Showing posts with label Transit. Show all posts

Monday, July 9, 2012

Traffic Signal Phasing Design - Dutch Practice

Today, after the student lecture I sat down with Theo Muller who is one of the most brilliant minds in traffic signal control in the Netherlands. He provided training on VRIGen which is a program used to develop signal timing phasing plans given the complexity of the movements for the multimodal system that is common with buses, trams, bikes, and pedestrians at so many intersections.
Signal Phasing Diagram (assuming a median) 


Incorporation of bikes, trams are something the Dutch have done because of the challenges or complexities these modes have presented as a part of large projects. The signal phasing numbering scheme is set up in VRIGen and it is used throughout the country to standardize and allow them to deal with all (most) possible options. It seems they have used every number from 1 to 100 to make the various modes work together under a standard umbrella.
Signal Phasing assuming Transit in the Median
Note: transit can turn from each direction and bikes wither would
be handled different than shown.


How is this different than the U.S.?
In the U.S., we have 8 vehicle phases, multiple overlaps, and pedestrian movements tied to the parallel vehicle and LRT is handled as a preempt as opposed to another movement. The standard signal controller is not prepared for light rail or bus crossings in both directions (east-west & north-south) running on the median. The Dutch also assume the special considerations of the use of multiple numbers to allow 2 stage crossings as a part of the bikes & peds because of their slower speeds. This also allows "following" phases to occur for vehicles so progression can be achieved through an interchange or a set of two signals, like you might have at a diamond interchange.


What common guidelines do they apply that the U.S. should adopt?
The maximum cycle length is a good place to start. 120 seconds is an eternity for peds and bikes and that value and higher is to going to result in poor compliance and high delays for public transport
Another common approach is to use snappy detector timing. The use of 1.5 seconds of extension from the upstream (advance) detector is limited to the detector placed 30 meters from the stop bar with a detector that is 12m long. They use a 2.5 gap on the stop bar detector with a 2.5 second extensin with presence mode enabled, meaning that when a vehicle is present on the detector it continues to ask for more green.
We discussed the use of leading pedestrian (or bike) intervals (LBI or LPI) and it was surprising to hear they use 2 secs. They use LBIs when there is no right turn lane exclusive for controlling the traffic separately in two separate "streams" which is much preferred in the Netherlands for safe operations that remain efficient. Notice I stated safety was first, Theo indicated that more than half of all signals are there for insuring safe conditions for all users. Our MUTCD is a far cry from that without the proper use of engineering judgement and a strong protection of future multimodal traffic growth.

What are the downsides of this approach?
There were a few things I would like to discuss more with a practicing Dutch traffic engineer. The common practice is to separate out the right turns. This clearly results in a different set of conflicts as shown here:
The bike movement is labelled 21 (on the left in the red brick area) and the right turn is labelled 6 in the graphic (to the left of the car you can see the right turn arrow). 
This sort of configuration represents a reduction in vehicular capacity if there is a heavy right turning traffic and the photo shows a shared left turning and through movement which results in some complications potentially. There is clearly an emphasis of bicycle movements at the intersections and in the photo you can see the pedestrian is not striped through the cycletrack. It is assumed that it is no problem for the people on bicycles to sort themselves out with pedestrians and it is clear to pedestrians that they aren't supposed to be in the cycletrack.

Wednesday, July 4, 2012

Haaglanden Regional Planning - Day 3

The speaker on Day 3 was Jan Termorshuizen from the Haaglanden who was has lectured to the class each year.
He described the overview of the region and what he's involved with. He highlighted the region's  Randstad Rail, cycling policy, physical planning and public transport, and Integral Planning.


An example of Integral Planning is the consideration that the Dutch must have for where water goes. Considering that much of the country is below sea level this is critical.

Population and Land Area - Details of the Hague

He described the Netherlands and compared it to the population and land area of Massachusettes, Conneticuit, & Rhode Island. From Wikipedia.

Area(2006)
 • City andmunicipality98.20 km2(37.92 sq mi)
 • Land82.66 km2(31.92 sq mi)
 • Water15.54 km2 (6.00 sq mi)
Population (1 February 2012)
 • City andmunicipality501,725
 • Density5,894/km2(15,270/sq mi)
 • Urban1,022,256
 • Metro1,406,000


He also indicated that there are 15.3 sq. km of Industrial estates and 35 sq km of greenhouses.

Regional Planning Over Time


The regional government is guided by the intent to "Do local what can be done local, Do regional what must be done regional", suggesting that there are some communities that aren't large enough to have the expertise to serve a community effectively. [My experience in private practice indicated that there was wide variety of expertise in government agencies of all sizes].

Jan described the history of planning based on his 30 years experience. In the 1970s and 1980s he indicated that the Dutch had a policy of "Bundled Deconcentration" with new light rail lines in Rotterdam, Den Haag, and Utrecht. There were more cars during this period and larger houses. They used selective urban renewal which included displacing people.

In the 1990s there was a shift to build at the edge of the cities and extend urban railways systems. There was quite a bit of effort to complete traffic demand management measures. People didn't like the demand management portion, so when there was success there was a change in how the policy was communicated.  Jan introduced the ABC land use zoning with A being the type of office that you can easily serve with transit and C being auto focused development. They began using their ABC location policy of offices being very important to be near rail stations and recognizing that not all development needs to be well served by rail or public transport and finding success. They have been very good in recognizing the importance of this and integrating bicycle use throughout all different types.

In the 3rd Millenium, he characterized the lack of money for investment and public transport operations. There is a more business like approach of public transport and reuse of existing

Their goals is to include 60-80% of new housing within close proximity of high quality transit lines. An example of this is that the new Delft rail station will be 1,500 housing units and a City building integrated there as well.

History of Community Planning in the Haaglanden

Pijnacker in 1950 was a small community, "village" on the rail line between Den Haag and Rotterdam. Nootdorp was off the rail line but in between Den Haag and Pijnacker.

Zoetermeer was a new town in 1965 when there was recognition of the need for more housing and became a much larger urban area. The planners focused a significant energy around that area and there were several areas to the southwest of Den Haag and Tanthof.

He indicated that it was not a good development because there were limited jobs in Zoetermeer, so people had to travel. It was also too far away to make cycling a reality (Dutch range of cyclists is 12 km away), and few people are biking to their jobs. Zoetemeer is off the major rail line between Den Haag and Rotterdam, so it only has a rail connection (spur line) to the central city and the frequency was not high enough because there were not enough people at the Den Haag Central Station to make it attractive.

The central city of Zoetemeer also suffered from lower densities than most of the communities. Most of the development were 2 stories. There were a few 20-story buildings, but they weren't very popular.

Ypenburg was built in 1995 and was a former Air Force Base. The community included an expansion of the existing tram system into the system and there was also a new railway station on line between Utrecht and Den Haag. Being on the major rail station gives Ypenburg a distinct transportation advantage (for serving non-auto trips). It is also only 5km from The Hague, so cycling is an option for more of its residents in getting to work.

Future plans from Zoetermeer is to reconstruct the heavy rail line to be part of Ranstad Rail so that there is more local service and it is a more comprehensive system. The smaller vehicles offer cheaper service and there can be higher frequencies. The light rail trains have better accel and decel properties, so overall Jan felt it was a higher quality of service for accessibility.

Future of Planning and Public Transport

There's a recognition of some of the missteps from the past and energy is being focused on using operations at stations along public transport lines. There interest currently in developing along exsting railways and trying to avoid office developments in decentralized locations.

Peter Furth indicated that in Boston, the suburban communities are fighting for office space because they pay additional taxes than residential property and they don't send children to schools (which the locals have to pay for as well). The Hague doesn't seem to have any issues that are similar to this.

Jan described the current focus on Integrating Public Transport into community. There are 8 principles:


All areas have a direct PT link with city center and one of two main railway stations
All stations have one or more light rail with stops near the main entrance.
All homes have a PT stop at a maximum distance of 500m
Trams have high frequencies, so transfer is no problem
All railway stations and many tram stops have bicycle parking facilities.
Many railway stations have park and ride facilties
Bicycles in trams are not permitted, in light rail only after 7:00 PM and in weekends
Popular OVfiets (PT bike) system: www.ov-fiets.nl will be integrated at each station.


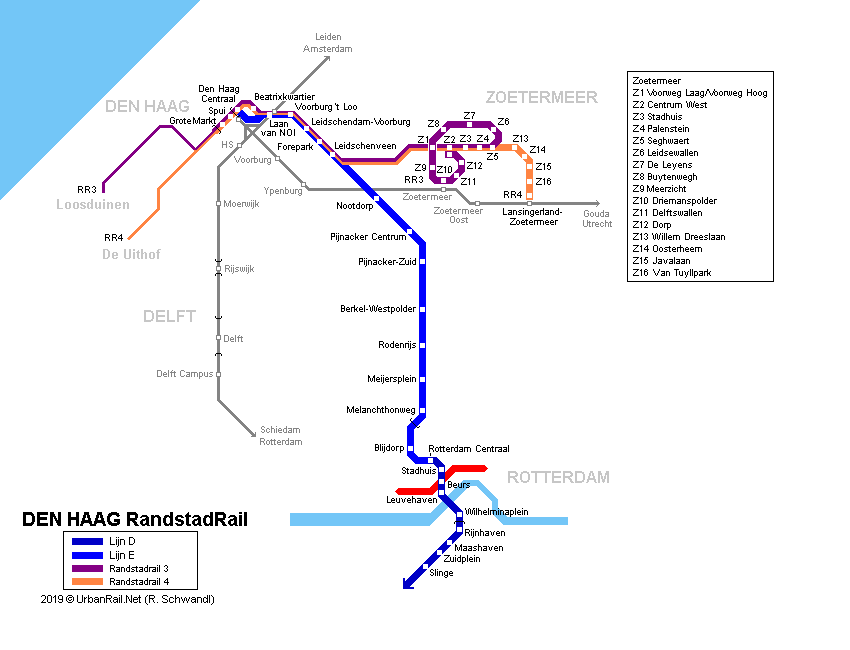
Jan summarized the Randstad Rail system map and how it influenced the planning.  I haven't actually used the tram during my time in Delft. I have used the bus, but not the tram. The map of the Delft Line 19 that is being expanded to the TU Delft campus.

Enough summarizing the presentation. It's now time for the tour of the community!


Sunday, October 2, 2011

Travelling on Amtrak with a Folding Bike - My Bike Friday Tickit to Ride

I am heading to the Walk 21 Conference in Vancouver BC to give a presentation on the work we're doing in Portland to encourage pedestrians. I wasn't sure I wanted to take my bike because I was worried about the hassle of having the bike and dealing with it on the train. In fact, I woke my wife up while waffling on whether I wanted to bike to the train station. It turns out it is very easy to stick it in the luggage rack three seats from where I am.

Yet, the woman that checked me in this morning threatened that I might have a problem when I transfer from train to bus in Seattle. I asked her what was I supposed to do in the case they didn't have space for it on the train and she calmly said, it would have to be on the next available train to BC. That next train arrives at 10:50 PM! How would that work? Clearly, this is one of the barriers to cycling. People (front counter people, myself included) expect it will be difficult to accomodate extra luggage on board. In some cases, it is simply an issue because you're dealing with folks that aren't always inclined to help, because they can't appreciate the challenge. I imagine people with disabilities have a similar challenge (although I say that appreciating that travelling with a bicycle is a choice).

Regardless of your situation, it takes a sort of confidence to persevere and with any luck on this trip, it will be worth the extra cost (if any).

UPDATE at 1:05 PM... During the transfer in Seattle to a bus, the driver of the bus indicated that I need to have a bag for the bike or else he can't take it. I had to tell him I didn't have a bag, the website did not indicate that it was necessary, and the gate agent in Portland (the second one that I talked to) told me it would be fine under the bus. Here's the specific language from the Amtrak website:
Folding bicycles may be brought aboard certain passenger cars as carry-on baggage. Only true folding bicycles (bicycles specifically designed to fold up into a compact assembly) are acceptable. Generally, these bikes have frame latches allowing the frame to be collapsed, and small wheels. Regular bikes of any size, with or without wheels, are not considered folding bikes, and may not be stored as folding bikes aboard trains.
You must fold up your folding bicycle before boarding the train. You may store the bike only in luggage storage areas at the end of the car (or, in Superliners, on the lower level). You may not store bikes in overhead racks.
The driver made me sign a waiver. I wrote on the back of the ticket stub that he took: "Liability Waiver" and signed by name. When I handed that to him, he gave it back to me and asked me to put a date on it. Apparently, this makes it official that if anything happens to the bike he is absolved of all wrong doing. Not that it should be a problem.

In other news, traffic on Interstate 5 in downtown Seattle is pretty bad at 1:12 PM when a football game is at the Seahawks stadium. Too bad I am not on the train.
Posted by Picasa

Tuesday, August 9, 2011

Pedestrian Countdown Timers and End of Green

An example where the pedestrian
countdown doesn't agree with the
vehicle signal indication.


I had a request inquiring about why the pedestrian countdown timer can't be used to give information to bus drivers, people riding their bikes, or people in their cars. I have had to give the response a few times, so I figured it was worth posting so I can refer back to it later.  

The pedestrian countdown timers are the new standard for indication of the amount of time that people crossing the street have to clear the intersection. There are many cases when the pedestrian logic in the traffic signal controller does not match the green time for the vehicles (people on cars and bicycles or transit vehicles) and for this reason we can not always end the green at the same time as the end of the countdown timer for the pedestrian indication (the time that we must make the decision to go from Walk to Flashing Don't Walk is obviously earlier than the time we decide to go to yellow).  
I use the countdown timer as an indication of how much time is left in the green at the intersection when I am on the street. That being said, it has to be used in context and I don't recommend that practice, especially if you're approaching an intersection at a high rate of speed. In that case, you should pay attention to the vehicle indications (green, yellow, and red) as this presents the information that is presented for you as a vehicle to obey. 

Wednesday, October 20, 2010

Baltimore City Response to Citizen Inquiry

I came across this letter from the City of Baltimore via Twitter. The City signals staff that I worked with (the transit agency was my client mostly), was pretty focused on moving cars. So, back then, I wouldn't have expected the mention of transit in a response about signal timing. It was a pleasant surprise, or is it greenwashing.

Wednesday, February 24, 2010

Streetcar Construction on Grand Avenue

The transition to working at the City has presented a tremendous amount of opportunities to contribute on projects happening "close to home". The Portland Streetcar is one of the most difficult projects because of the range of traffic impacts associated with construction throughout the project and the pace that is anticipated by the Project Team. The primary intent with the expedited schedule is to control costs and to reduce business impacts which are laudable goals.
The first two photos here were shot the first week in February outside of Metro's office building, literally two days after they began construction. The last photo was taken less than two weeks later and shows the concrete slab with the rails completely in place in this section of the project. I have heard that the intent is to be in and out of a block within four weeks. At this pace, it appears that it's possible given that the crews are able to work during the peak hours of traffic.
We're working on the traffic impacts and exploring ways we can reduce the adverse impacts of the construction. One of the strategies we've undertaken is to install six cameras that can be used to monitor conditions along the corridor. The cameras will allow us to visually identify the positive effects of the signal timing changes we implement on the corridor. It would be advantageous if we had the ability to implement Media Access Control (MAC) readers to measure the actual performance on the street system.
Posted by Picasa

Monday, February 15, 2010

Transit Signal Priority in Boulder

I worked on this project and wasn't able to take the project to implementation unfortunately. This is disappointing one of the key frustrations was that so much of the work in consulting didn't lead to building something or making it better. I found myself trying to make the perfect decision. Hopefully, the new team on the job can build a project that meets the needs of Boulder County.

I blame the missed opportunity on the old cost benefit analysis which stifles the ability of engineers to make decisions. At times, we ask for these analyses when we want to make sure we're doing the right things, yet we don't ask for these to study some of things we already do. Taking into account the environment is a significant challenge and there's a lot of guess work that's going to be necessary in the short-term to make good decisions for our world.

Thursday, January 21, 2010

Blogs on Transportation

There are some great blogs that I peruse from time to time that I thought I would put a note about. BikePortland.org is my favorite and I do like Portland Transport. BikePortland is a great source of information, but the past couple of days I have been enjoying GreaterGreaterWashington which is very pleasing visually and has good information as well.

Tuesday, December 29, 2009

Baltimore Bus Lanes Make Debut

About a year ago, I studied the feasibility of bus/bike lanes for downtown Baltimore to improve bus reliability and bicycle safety. It was one of my favorite projects as we studied downtown traffic and the potential benefits of reducing conflicts for bus operations. There was early discussion of doing painted bus lanes, but it looks like they finished without adding the pavement color. The video has good feedback from bus riders, hopefully they will study whether the bus operations actually improves with the project.

Friday, October 9, 2009

Boise Streetcar News

I've been on the news twice in the past week. I was walking to the MAX at Pioneer Square and was asked whether the Made in Oregon sign should stay the same. As a Beaver, of course the sign shouldn't have any U of Zero influences.

Today, upon leaving downtown Boise after happy hour I was asked what I think about the streetcar in downtown, so I gave them a piece of my mind. They didn't get the whole bit, but enough for a sound bite.

Thursday, August 27, 2009

Bus Reliability in DC

 
I was in DC yesterday for the National Bus Rapid Transit Institute Advisory Board Meeting and on the way to the meeting I was reminded about how we've got a lot of work to do to improve transit service. As I was walking to the meeting, I took this photo of a Route 52 buses bunched up at the intersection of 14th & L Street NW. I walked for about a mile and captured this image after seeing it occur twice within 10 minutes. The real-time passenger information system wasn't reporting this through the NextBus Arrival system very accurately either, so there's work to be done to improve both the management of the system and the technology behind it.
Posted by Picasa

Saturday, August 8, 2009

Portland's Traffic Signals Recieve Mention in Portland Monthly

Posted in the "I know that guy" category, there was an article on the traffic signals along the new light rail line for Portland's bus mall. Equating the signal controller upgrade as moving from a Commodore 64 to a early 80s Macintosh was a nice touch to explain that our traffic signal controllers don't have too much processing power. Portland Monthly Magazine / Past Issues / Archives / Detail

Posted using ShareThis

Monday, July 6, 2009

Secretary of Transportation Visits Portland

I wasn't in Portland to enjoy the festivities, but it sounds like the visit from the Secretary of Transportation was a success. I liked the comment that transit is in the DNA of the City.
There was a good commentary on the topic on Oregon Live http://www.oregonlive.com/opinion/index.ssf/2009/06/the_once_and_future_streetcar.html

The details of how it all is being built would be great to get involved in.

Monday, June 15, 2009

Baltimore Streetcar Press

I worked on this project several years ago when it started out so it is fun to watch the trolley go down the tracks, pardon the pun.

Monday, February 23, 2009

The Role of Transportation in a Sustainable Future

The Role of Transportation in a Sustainable Future
The scientific community believes that greenhouse gases emissions, especially carbon dioxide, needs to be reduced by 50 to 80 percent by 2050 to stabilize the climate and avert economic and environmental cataclysm (IPCC, 2007). Transportation is responsible for about one-third of greenhouse gas emissions in the United States; passenger automobiles and light trucks alone contribute 21 percent. The built environment, transportation plus the building sector, accounts for more than half of the nation’s emissions. Increasing fuel efficiency and decreasing the carbon content of fuels can reduce vehicles’ greenhouse gas emissions, but the emissions reductions from technological fixes will be overtaken by the continuing growth in vehicle miles traveled (VMT). It’s clear that in order to reach our climate goals, we will have to reverse the upward trend in vehicle miles traveled.
A new culture of innovation is needed in transportation within our communities, as traditional solutions alone will not suffice. The suburban development patterns that have been aided by outdated policies must be changed to encourage better choices and more effective integration of land use, transit, cycling, and walking. Effective transit has the potential to serve our communities as we saw this summer as people found transit as an alternative to the high prices of gas. Yet public transit, carpooling, biking, and walking are unattractive in many cities because of the built environment we have created in the past forty years. In order to improve our communities and reduce carbon emissions, we have to find a way to improve public transit thereby changing the way our communities travel.
Is ITE and the Transit Community Prepared to Address this Issue?
The tools that ITE has been developing are starting to address these issues. The Context Sensitive Solutions Handbook is an example of a document that can be used to improve our communities given the realities of today’s challenges. The soon to be released Signal Timing Manual describes the importance of establishing policies prior to changing traffic signals and encourages the consideration of all modes. The use of these tools however lags because the dialogue within engineering circles remains largely focused on the old paradigm and the transportation policies of 1960s. We continue to consider moving cars as opposed to people in our communities, we favor single land uses as opposed to mixed ones, and we use tools that only consider automobiles as opposed to all users.
The Trip Generation and Parking Generation Manual are two documents that exacerbate the auto-dominated design of our communities and their use by many engineers fails to address the modes that are most important to our future. The Trip Generation Manual has a section on shared trips that considers multi-purpose trips within a single mixed-use development, but this is still very automobile focused and barely mentions transit. Further, concurrency requirements imposed in some jurisdictions limit development based on the projected capacity of available infrastructure, including roadway capacity. For example, developers might be required to pay for roadway expansion if a project is projected to increase traffic when road Level-of-Service degrades from C to D (Litman, 2005). This action discourages infill development and fosters dispersed, automobile-dependent sprawl. Revised concurrency requirements take into account the reduced per capita traffic generation, shorter trips and improved travel options in urban areas, and so allow more infill development (Wallace, January 2005).
Alternatives to concurrency models include use of a multimodal level of service concept or accepting congestion in exchange for transit improvements. If congestion increases, people change destinations, routes, travel time and modes to avoid delays. The competitiveness between travel alternatives has a significant effect on the use of various alternatives: For the alternatives that are inferior, travelers will choose the most attractive travel alternatives. The actual number of motorists who shift from driving to transit may be relatively small, just a few percent of total travelers on the corridor, but that is enough to reduce roadway congestion delays.
We must develop resources that address the new direction our communities will need to address the issue of climate change. Resources and handbooks are not enough to address the issue and may not be as important as steps that are necessary to result in a culture shift within the engineering community. This culture shift would be based on new values and a vision for the future. A vision which replaces the mindset that traffic delays must be mitigated, but rather seen as an opportunity to apply new techniques to improve transit, thereby helping transform travel behavior in the future.
Workshops to Cultivate Cooperation between Transit and Engineering
To meet these needs, the Institute of Transportation Engineers is excited about the opportunity to host five workshops to discuss model actions to shift our industry’s focus toward more sustainable transportation solutions. To attract discretionary riders (travelers who have the option of driving), public transit must be fast, comfortable, convenient and affordable. Engineers have an important role to helping transit agencies achieve this goal. A brief comparison of light rail transit and mixed flow bus service indicate the deep divide in investment and quality of transit. Light rail transit provides a travel time advantage that tends to attract discretionary riders. When transit is faster than driving, a portion of travelers shift mode until the congestion declines to the point that transit is no longer faster).
Transportation problems can be viewed as individual problems with technical solutions or opportunities to affect behavior. Traffic and parking congestion require building more roads and parking facilities, but these solutions improve the competitiveness of auto traffic as it compares to transit or non-motorized traffic options. To make the change our communities need, we need to focus on moving people and goods rather than vehicles. In dense cities, transit saves valuable space and energy compared to private automobiles and must be improved to maintain our mobility. Cities must also invest in bicycling and walking to further increase the opportunities for people to maintain a healthy lifestyle.
Transportation systems are a critical element of a strong economy, but can also contribute directly to building community and enhancing quality of life. As engineers, we have a responsibility to act as stewards of the natural environment, undertaking to help our communities make sustainable choices with regard to personal movement and consumption.

Other worthwhile facts to communicate the message:
According to the American Public Transportation Association, public transportation reduces carbon dioxide emissions by 6.9 million metrics tons annually, yet only 2 percent of the trips taken in the U.S are via this mode.
Eighty-two per cent of Manhattan residents travel to work by public transit, by bicycle, or on foot.Transit accounts for only 2 percent of passenger miles traveled in the U.S.
A study published in the City Journal stated that in almost every metropolitan area, carbon emissions are significantly lower for people who live in central cities than for people who live in suburbs (Glaeser, 2009, Winter). It goes on to suggest that land-use regulations bind most tightly in the places (existing cities) where environmental concerns should lead us to have the most growth.
An average U.S. urban dweller uses 24 times more energy annually for private transport as a Chinese urban resident, and around five times as much as a resident of a European city of equal economic prosperity. (Kenworthy, 2004)

Monday, January 19, 2009

Marketing the Environment

  At the Annual Transportation Research Board meeting, I couldn't help notice the marketing associated with the environment. That and the Obama inauguration were the two big topics, could it be that they are related? Regardless, the first of the pictures is a campaign by Chevron entitled Will you Join Us? and centers on saving energy by biking, using less energy (unplugging computers?), going solar, etc. Is it just me that finds it strange to have big oil pushing this concept?
That being said, they are paying to advertise on transit, which helps WMATA pay for service and consultants, so I have to say thanks to Chevron, but I do so with a bit of a cynical perspective just wondering whether their intent is environmental or self-serving. There was a recent article in the Wall Street Journal that suggested that consumers (I consider my clients consumers of my services) are willing to pay for companies that they feel support the green cause.
  On the other hand, I saw these two banners in the subway that was designed to provoke the question, there's no such thing as clean coal. Here they have Chewbaca (or is this Bigfoot) holding a piece of coal. The alien is probably a clearer image, yet with the X Files still fresh in my mind I am not sure if they're not real.
 
Posted by Picasa

Saturday, January 10, 2009

Portland's New Leadership


I attended the new mayor's inauguration party on Monday and you know the leadership is going to be different when the entertainment begins with March Fourth (the performance marching band) and followed up by the singing of Storm Large, and Luis from Sesame Street accompanied by the piano of Thomas Lauderdale of Pink Martini. They sang a song from Sesame Street which was a little surreal. This was followed by a performance by Wanderlust Circus and their self described freaks.

The promise of the next 100 days looks good, there will be a definite focus on transportation and I am looking forward to being a part of it.


TRANSPORTATION

1. Develop a four-year strategic vision for Portland’s transportation investments and infrastructure
a. Appoint a Transportation Cabinet
b. Initiate development of a strategic transportation investment plan as a component of the Portland Plan
c. Advocate for federal stimulus package
d. Conduct a snow and ice storm readiness assessment for the city and region; develop a plan of action for future efforts and investment
e. Provide leadership and support to secure passage of a transportation funding package at the State Legislature
2. Expand Portland’s transit network to provide transportation options and leverage development opportunities
a. Identify the local funding match necessary to secure federal funds for the Milwaukie to Portland light rail line
b. Release the draft of city-wide Streetcar System Plan
c. Advance the funding and development of a new Eastside Streetcar line
3. Enhance the safety and accessibility of bicycling for everyone
a. Announce the release of an updated Bicycle Master Plan for the city
b. Unveil the City’s first Cycle Track in a high-visibility, high-use location to promote safety and increase bicycle use
c. Identify 15 miles of Bicycle Boulevards for implementation in 2009
d. Complete the next link in the Bike Boulevard network on N Wabash, connecting N Willamette Blvd to the bike path along the Columbia River
e. Deliver on-street bike parking corrals in four or more high-demand locations
4. Improve safety and mobility on Portland’s roadways
a. Promote state legislation to give cities jurisdiction over speed limits within city limits
b. Identify funding for high-priority arterial paving projects
c. Support a Columbia River Crossing bridge project that truly serves Portland’s needs and interests
i. Achieve a high-quality, aesthetically appealing bridge design that is appropriate for Portland’s “front door”
ii. Secure world-class bicycle and pedestrian accommodations on (and accessing) the bridge
iii. Ensure the bridge supports the city’s land use and transportation goals as set out in the Portland Plan
d. Prioritize projects that offer high-impact improvements for moving freight
5. Showcase “green” transportation technologies
a. Develop a “Get Charged Portland” strategy to increase electric car availability and use

Wednesday, June 25, 2008

Carfree Conference

Volunteering in the morning
I had a nice meeting Jay Graves and other bike celebrities. I had to scrounge for lunch at the conference as a wheat free, dairy free allergy guy.
I worked for a bit, delegated tasks I can't get to, and then hope that people work on
my stuff. Overextend myself on a project (bike related), promise things I don't have. I am working on everything I want to, but it is too much good stuff.

Go to City Hall to volunteer where people are drinking beer (I am helping pour) and checking out the bicycle postcard art show. It was pretty surreal. Bike related Sidewalk art, Sprockettes, and tall bikes.... And then to top it off there were the depave frogs on stilts.

Took the bus to SE where the speakers were celebrating the conference. Got to see Patrick and Jamie there and feeling good about helping them explore their interests. Really happy about how that's working out, hoping they are enjoying it too. Still it never seems like enough and is going to be transparent to others at KAI, which I seek some sort of validation from. Wish I didn't, but that's me.

Now checking my Treo as I try to make the perfect connection from the 15
to the 70 to get home. Glad I live in a transit rich area.

Carfree!

Monday, May 26, 2008

I-5 Columbia River Crossing Project Article in Willamette Week

It is great that Portland has such an integrated transportation/environment to media system. It seems like every three weeks there is a huge article on the issues. It is great to see that the concept of induced traffic is alive and well. Although I don't agree with the concept like I used to. I think it is more like a system. Increased road capacity leads to land use patterns that utilize that capacity, i.e. people buy homes that are to their liking (reasonable commute, land for the kids to play, "safer" communities, newer parks, nice schools that leave the poor neighbors behind, lower taxes because they don't pay for the infrastructure like museums/libraries/Convention Center if owned by the City/etc, further from their work because the commute isn't that bad, and then later when it gets bad the community asks for improvements so that they don't have to move.

So at the end, you have travel that increases not because of the additional capacity persay, but rather becuase of the land use that follows the roadway capacity. The challenge is you need a certain amount of capacity to address freight and other important societal needs. I am not sure what the right answer is, I guess it would have to be improve the bridge, but make sure there is high speed transit and auto capacity (properly priced), and of course bicycle facilities.


Anyway, here's the excerpt: In fact, if you build it, however, they will drive…more.

There’s a concept transportation planners call “induced travel,” which means more road capacity results in more traffic.

While the precise relationship between capacity and demand remains under debate, CRC figures show if a new bridge were built without tolls, the number of people crossing the Columbia would increase dramatically, versus the no-build option. Figures show that without tolls, a new bridge would carry 225,000 passengers a day by 2030, while the current bridges, if left in place, would carry only 184,000. The difference of 41,000 is the “induced travel” generated by the newly built capacity.

If, as the task force proposes, the new I-5 bridge is tolled, and an adjacent light-rail, bicycle and pedestrian bridge is built, that combination would reduce traffic by 47,000 car trips, leaving only a small net reduction—6,000 trips from the no-build scenario (see chart below).

Monday, May 12, 2008

American Commuting Patterns and Travel Trends

An excerpt from the Transportation Research Forum.

Alan E. Pisarski, Author of Commuting in America III
Feb. 13, 2008

Alan Pisarski's remarks were based in large part on the third edition of this book Commuting in America III, published in 2006. People travel on the earth's surface for many reasons – to get to work, go on vacation, transport freight, and provide private and government services (power, water, police protection, etc.). Commuting is a shrinking part of surface transportation. Daily trips to work have not increased per capita since 1975, while family/personal business trips have doubled and school/church trips have increased.

Three major trends will define future commuting.

Replacing the baby boomers in the workforce – Where will the workforce come from?
Continued expansion of metro areas – the doughnut metro with the focus on the suburbs
An affluent time-focused society – we value our time at $50 an hour and the value of goods moved triples.
Mr. Pisarki's listed his "Top 10" factors that will shape commuting:

#10 – Single-occupancy vehicle travel growth slows: It's currently about 80%, but trend-setting metro areas such as Seattle, San Francisco, Portland, Phoenix, and Atlanta have shown drops in single-occupancy vehicle travel

#9 – Regional swings in carpooling and transit use from 1990 to 2000: Carpooling dropped dramatically in the Northeast, but grew by a large margin in the West. Transit use declined slightly in three regions, but increased in the West.

#8 – The growth of automobile ownership among African-Americans: From 1990 to 2006 the percent of African-Americans owning automobiles rose from 70 percent to 80 percent

#7 – Immigrant roles and patterns: Immigrants make up only 14 percent of workers, but have an impact on certain commuting modes. Carpooling is popular with immigrant communities, but drops off the longer they live in the United States. They are also more likely to use mass transit.

#6 – Older workers: while the percent of people over 55 who are still working is going up, many work from home. After 55 more people start taking alternatives to single-occupancy vehicles.

#5 – Increases in extreme commutes (longer than 60 minutes): In 2005 10 million people took longer than 60 minutes to get to work. Major population center states such as New York, New Jersey, and California ranked in the top 10 in longest average commute, but West Virginia, Louisiana, and Mississippi were also in the top 10.

#4 – The "donut" metro: The largest job growth has been in the suburbs. The largest percent of commutes are within suburbs. In addition 7.5 million people commute to the suburbs both from central cities and another 7.5 million from rural areas and exurbs to the suburbs.

#3 – Continuing growth of working at home: This is one of only two "modes" of commuting (the other being driving alone) that has shown continuous growth since 1980. Today working at home includes 4 percent of workers.

#2 – Workers out before 6 a.m.: The rush hour spreads out as a larger percent of people start from home before 6 a.m., and the percent that commute between 6 and 9 a.m. shrinks.

#1 – Increase in workers leaving their home county to work: More than one-fourth of worker now leave their home county for work. The Washington, DC, metropolitan area leads the nation in this trend.

In response to a question, Mr. Pisarski said that there are huge forces working against mass transit growth: the spreading out of the population away from central cities, increasing wealth, aging population, and continued preference for automobiles.